خوشه بندی ++K-Means در پایتون — راهنمای کاربردی
در این راهنما، از PySpark، که یک «پوشش پایتون» (Python Wrapper) برای «آپاچی اسپارک» (Apache Spark) است، به منظور پیادهسازی الگوریتم ++K-Means استفاده خواهد شد. با وجود آنکه PySpark دارای یک پیادهسازی خوب برای ++K-Means است، در مطلب پیش رو، یک پیادهسازی کامل و از پایه برای این الگوریتم ارائه شده است.
پیکربندی PySpark Notebook
در این مطلب فرض شده که کاربران، PySpark را روی «ژوپیتر نوتبوک» (Jupyter Notebook) نصب دارند.
بارگذاری مجموعه داده به عنوان RDD
پیش از آغاز کار، مجموعه داده ایستگاه هواشناسی را باید دانلود کرد. مجموعه داده مذکور، از این مسیر [+] دردسترس است. با بهرهگیری از قطعه کد زیر، میتوان مجموعه داده را بارگذاری کرد.
def parse_data(row):
”’
Parse each pandas row into a tuple of
(station_name, feature_vec),`l
where feature_vec is the concatenation of the projection vectors
of TAVG, TRANGE, and SNWD.
”’
return (row[0],
np.concatenate([row[1], row[2], row[3]]))
## Read data
data = pickle.load(open(“stations_projections.pickle”, “rb”))
rdd = sc.parallelize([parse_data(row[1])
for row in data.iterrows()])
میتوان دادههای موجود در مجموعه داده را مشاهده و بررسی کرد. در این راستا میتوان از کد زیر بهره برد.
rdd.take(1)

نام ایستگاه هواشناسی که از مجموعه داده آن استفاده شده، USC00044534 است. دیگر مواردی که در تصویر موجود هستند، دادههای آب و هوایی محسوب میشوند که برای خوشهبندی مورد استفاده قرار خواهند گرفت.
وارد کردن کتابخانهها
با بهرهگیری از قطعه کد زیر، میتوان کتابخانههای مورد نیاز برای ادامه کار را «وارد» (Import) کرد.
import numpy as np
import pickle
import sys
import time
from numpy.linalg import norm
from matplotlib import pyplot as plt
تعریف پارامترهای سراسری
تعداد «مرکزوارها» (Centroids) در این مساله برابر با ۵ در نظر گرفته میشود. تعداد K-Meansهایی که به طور موازی با هم اجرا میشوند نیز ۲۵ مرتبه است.
# Number of centroids
K = 5
# Number of K-means runs that are executed in parallel. Equivalently, number of sets of initial points
RUNS = 25
# For reproducability of results
RANDOM_SEED = 60295531
# The K-means algorithm is terminated when the change in the
# location of the centroids is smaller than 0.1
converge_dist = 0.1
تابع کاربردپذیری
تابعهای زیر، هنگامی که پیادهسازی به پیش میرود، مفید واقع میشوند.
def print_log(s):
”’
Print progress logs
”’
sys.stdout.write(s + “\n”)
sys.stdout.flush()
def compute_entropy(d):
”’
Compute the entropy given the frequency vector `d`
”’
d = np.array(d)
d = 1.0 * d / d.sum()
return -np.sum(d * np.log2(d))
def choice(p):
”’
Generates a random sample from [0, len(p)),
where p[i] is the probability associated with i.
”’
random = np.random.random()
r = 0.0
for idx in range(len(p)):
r = r + p[idx]
if r > random:
return idx
assert(False)
مقداردهی اولیه مرکزوارها
در الگوریتم ++K-Means، کاربر میخواهد که مرکزوارها در مقداردهی اولیه تا حد ممکن از هم دور باشند. ایده نهفته در پس این روش آن است که مرکزوارها به مرکز خوشههای واقعی نزدیکتر باشند و بنابراین سریعتر به همگرایی برسند.
def kmeans_init(rdd, K, RUNS, seed):
”’
Select `RUNS` sets of initial points for `K`-means++
”’
# the `centers` variable is what we want to return
n_data = rdd.count()
shape = rdd.take(1)[0][1].shape[0]
centers = np.zeros((RUNS, K, shape))
def update_dist(vec, dist, k):
new_dist = norm(vec – centers[:, k], axis=1)**2
return np.min([dist, new_dist], axis=0)
# The second element `dist` in the tuple below is the
# closest distance from each data point to the selected
# points in the initial set, where `dist[i]` is the
# closest distance to the points in the i-th initial set
data = (rdd
.map(lambda p: (p, [np.inf] * RUNS)) \
.cache())
# Collect the feature vectors of all data points
# beforehand, might be useful in the following
# for-loop
local_data = (rdd
.map(lambda (name, vec): vec)
.collect())
# Randomly select the first point for every run of
# k-means++, i.e. randomly select `RUNS` points
# and add it to the `centers` variable
sample = [local_data[k] for k in
np.random.randint(0, len(local_data), RUNS)]
centers[:, 0] = sample
for idx in range(K – 1):
########################################################
# In each iteration, you need to select one point for
# each set of initial points (so select `RUNS` points
# in total). For each data point x, let D_i(x) be the
# distance between x and the nearest center that has
# already been added to the i-th set. Choose a new
# data point for i-th set using a weighted probability
# where point x is chosen with probability proportional
# to D_i(x)^2 . Repeat each data point by 25 times
# (for each RUN) to get 12140×25
########################################################
#Update distance
data = (data
.map(lambda ((name,vec),dist):
((name,vec),update_dist(vec,dist,idx)))
.cache())
#Calculate sum of D_i(x)^2
d1 = data.map(lambda ((name,vec),dist): (1,dist))
d2 = d1.reduceByKey(lambda x,y: np.sum([x,y], axis=0))
total = d2.collect()[0][1]
#Normalize each distance to get the probabilities and
#reshapte to 12140×25
prob = (data
.map(lambda ((name,vec),dist):
np.divide(dist,total))
.collect())
prob = np.reshape(prob,(len(local_data), RUNS))
#K’th centroid for each run
data_id = [choice(prob[:,i]) for i in xrange(RUNS)]
sample = [local_data[i] for i in data_id]
centers[:, idx+1] = sample
return centers
# The second element `dist` in the tuple below is the
# closest distance from each data point to the selected
# points in the initial set, where `dist[i]` is the
# closest distance to the points in the i-th initial set
data = (rdd
.map(lambda p: (p, [np.inf] * RUNS)) \
.cache())
# Collect the feature vectors of all data points
# beforehand, might be useful in the following
# for-loop
local_data = (rdd
.map(lambda (name, vec): vec)
.collect())
# Randomly select the first point for every run of
# k-means++, i.e. randomly select `RUNS` points
# and add it to the `centers` variable
sample = [local_data[k] for k in
np.random.randint(0, len(local_data), RUNS)]
centers[:, 0] = sample
for idx in range(K – 1):
########################################################
# In each iteration, you need to select one point for
# each set of initial points (so select `RUNS` points
# in total). For each data point x, let D_i(x) be the
# distance between x and the nearest center that has
# already been added to the i-th set. Choose a new
# data point for i-th set using a weighted probability
# where point x is chosen with probability proportional
# to D_i(x)^2 . Repeat each data point by 25 times
# (for each RUN) to get 12140×25
########################################################
#Update distance
data = (data
.map(lambda ((name,vec),dist):
((name,vec),update_dist(vec,dist,idx)))
.cache())
#Calculate sum of D_i(x)^2
d1 = data.map(lambda ((name,vec),dist): (1,dist))
d2 = d1.reduceByKey(lambda x,y: np.sum([x,y], axis=0))
total = d2.collect()[0][1]
#Normalize each distance to get the probabilities and
# reshape to 12140×25
prob = (data
.map(lambda ((name,vec),dist):
np.divide(dist,total))
.collect())
prob = np.reshape(prob,(len(local_data), RUNS))
#K’th centroid for each run
data_id = [choice(prob[:,i]) for i in xrange(RUNS)]
sample = [local_data[i] for i in data_id]
centers[:, idx+1] = sample
return centers
پیادهسازی الگوریتم ++K-Means
اکنون که تابع مقداردهی اولیه وجود دارد، میتوان از آن برای پیادهسازی الگوریتم ++K-Means استفاه کرد.
def get_closest(p, centers):
”’
Return the indices the nearest centroids of `p`.
`centers` contains sets of centroids, where `centers[i]` is
the i-th set of centroids.
”’
best = [0] * len(centers)
closest = [np.inf] * len(centers)
for idx in range(len(centers)):
for j in range(len(centers[0])):
temp_dist = norm(p – centers[idx][j])
if temp_dist < closest[idx]:
closest[idx] = temp_dist
best[idx] = j
return best
def kmeans(rdd, K, RUNS, converge_dist, seed):
”’
Run K-means++ algorithm on `rdd`, where `RUNS` is the number of
initial sets to use.
”’
k_points = kmeans_init(rdd, K, RUNS, seed)
print_log(“Initialized.”)
temp_dist = 1.0
iters = 0
st = time.time()
while temp_dist > converge_dist:
# Update all `RUNS` sets of centroids using standard k-means
# algorithm
# Outline:
# – For each point x, select its nearest centroid in i-th
# centroids set
# – Average all points that are assigned to the same
# centroid
# – Update the centroid with the average of all points
# that are assigned to it
temp_dist = np.max([
np.sum([norm(k_points[idx][j] – new_points[(idx,
j)]) for idx,j in new_points.keys()])
])
iters = iters + 1
if iters % 5 == 0:
print_log(“Iteration %d max shift: %.2f (time: %.2f)” %
(iters, temp_dist, time.time() – st))
st = time.time()
# update old centroids
# You modify this for-loop to meet your need
for ((idx, j), p) in new_points.items():
k_points[idx][j] = p
return k_points
تست بنچمارک
زیبایی الگوریتم ++K-Means سرعت همگرایی آن با توجه به الگوریتم مقداردهی اولیه است. همچنین، اسپارک برای موازیسازی این الگوریتم تا حد امکان، مورد استفاده قرار میگیرد. در ادامه، پیادهسازی انجام شده، «بنچمارک» (Benchmark) میشود.
st = time.time()
np.random.seed(RANDOM_SEED)
centroids = kmeans(rdd, K, RUNS, converge_dist,
np.random.randint(1000))
group = rdd.mapValues(lambda p: get_closest(p, centroids)) \
.collect()
print “Time takes to converge:”, time.time() – st
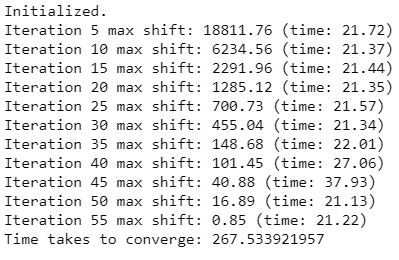
بسته به تعداد هستههای پردازشگر (Processor Cores)، حافظه هسته تنظیم شده برای هر اجرا کننده و تعداد اجراگرها متفاوت خواهد بود.
تابع هزینه
به منظور تعیین صحت مدل، نیاز به انتخاب یک تابع هزینه و تلاش برای کمینه کردن آن با استفاده از مدل است. تابع هزینه نهایی، دیدگاهی از میزان صحت مدل ارائه میکند. برای K-Means، به فاصله بین نقاط داده و نزدیکترین مرکزوارها نگاه میشود.
def get_cost(rdd, centers):
”’
Compute the square of l2 norm from each data point in `rdd`
to the centroids in `centers`
”’
def _get_cost(p, centers):
best = [0] * len(centers)
closest = [np.inf] * len(centers)
for idx in range(len(centers)):
for j in range(len(centers[0])):
temp_dist = norm(p – centers[idx][j])
if temp_dist < closest[idx]:
closest[idx] = temp_dist
best[idx] = j
return np.array(closest)**2
cost = rdd.map(lambda (name, v): _get_cost(v,
centroids)).collect()
return np.array(cost).sum(axis=0)
cost = get_cost(rdd, centroids)
log2 = np.log2
print “Min Cost:\t”+str(log2(np.max(cost)))
print “Max Cost:\t”+str(log2(np.min(cost)))
print “Mean Cost:\t”+str(log2(np.mean(cost)))
خروجی:
Min Cost: 33.7575332525
Max Cost: 33.8254902123
Mean Cost: 33.7790236109
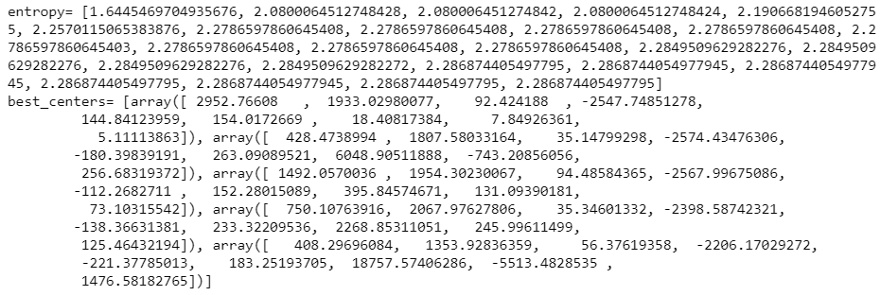
نتایج نهایی
نتایج نهایی به صورت زیر است:
print ‘entropy=’,entropy
best = np.argmin(cost)
print ‘best_centers=’,list(centroids[best])
اگر نوشته بالا برای شما مفید بوده است، آموزشهای زیر نیز به شما پیشنهاد میشوند:
- مجموعه آموزشهای آمار، احتمالات و دادهکاوی
- آموزش خوشه بندی K میانگین (K-Means) با نرم افزار SPSS
- مجموعه آموزشهای یادگیری ماشین و بازشناسی الگو
- پیاده سازی الگوریتم های یادگیری ماشین با پایتون و R — به زبان ساده
- خوشه بندی k میانگین (k-means Clustering) — به همراه کدهای R
